 will stedden
Q&A on the Route Crime Calculator
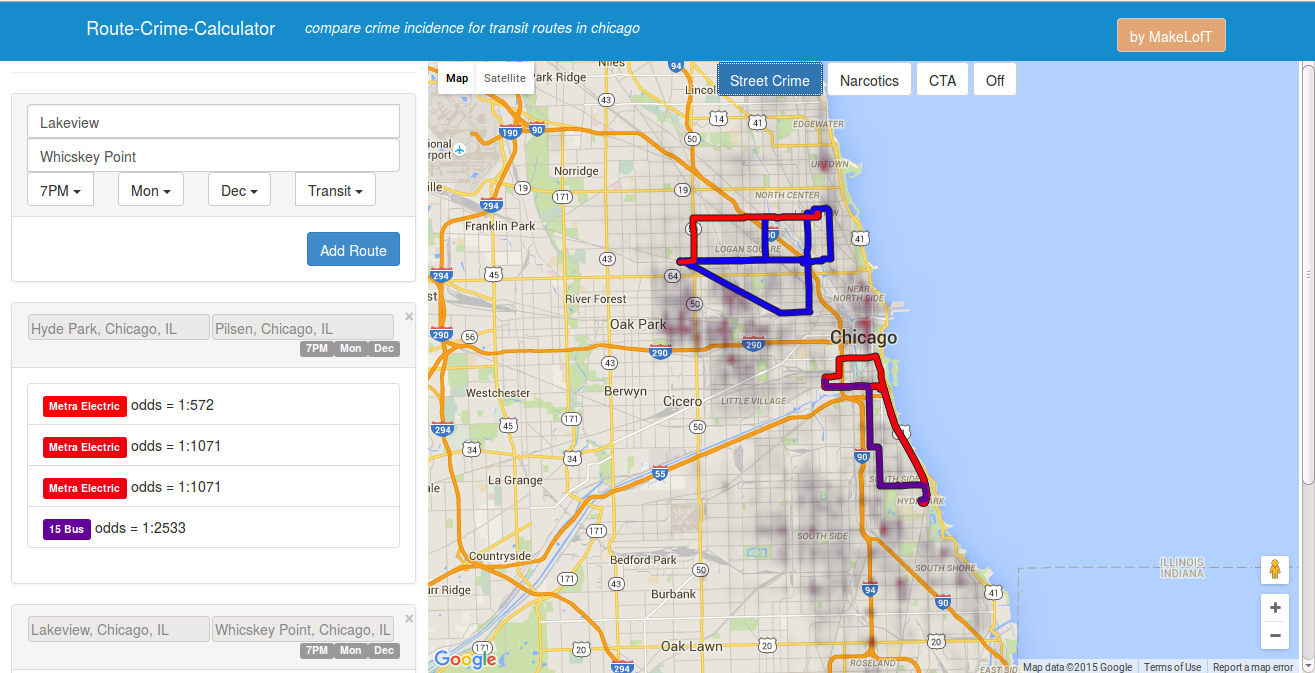
I've recently built a cool little web app that helps evaluate the number of crimes occurring along a person's travel route in the City of Chicago. To elaborate a little on the rationale and methodology, I've written this blog post where I answer some plausible questions.
How safe is travelling around in Chicago?
That's hard to say, but hopefully I've made it a little easier to evaluate that. Obviously both native Chicagoans and visitors to the city have often find themselves travelling on public transit through neighborhoods that can make them feel unsafe. I wanted to explore this question and give some way to compare different routes and parts of the city so I started analyzing some of the city's open crime data for answers. This led to some interesting results so I decided to try to open that data up to the public in some reasonable way by making a little webapp.
So what can it do?
To help prevent exposure to crime and to make everybody feel more safe, this tool evaluates the likelihood of criminal activity based on your transit route. It shows a few options and let's you see whichever one is the "safest."
So it's like minority report or something?
The problem of predicting crime has been tackled before in Chicago and elsewhere. However, it seems like most of the focus I've seen on this matter focused on its relation to policing strategies rather than public awareness. I don't intend to predict crimes, and I certainly don't want to build a tool that could be used to unfairly target citizens. I'd prefer that everybody just be aware of the real dangers (or lack of dangers) presented to them. I wanted to make something that helps the average person better evaluate exactly what they are facing when they take to the street every day.
So then what exactly does it do?
This tool is really just a fancy database query that looks up the past crimes that have occurred at any block in the city. I break the data up based on time of day, day of the week, and month of the year to make the prediction as accurate as possible. With that data, I can compute the average number of crimes that occur at that time and place over the past couple of years, which gives me a rate for crime occurrence.
Now from good old Google Directions API, I can find out for each route how long you're going to spending in a given region. And from that I can simply add up the total number of crimes that will happen in an area during the time that you will be there. I repeat that for all the areas that you will pass through on your route and that's the total number of crimes that will happen in your vicinity during your trip.
So you present some big number of crimes?
Surprisingly no. The number of crimes is actually pretty darn small, so I present a relatively tiny probability of a crime occurring, in the form of classic betting odds.
And you're satisfied with that?
Actually I'm pretty disappointed with the final result because there's a huge half of the story missing. To really present how likely a crime is to happen to you, I need to know how many people are on the street when a crime occurs. That means I need to have some idea about street traffic, which is harder to find than you'd think. This is my quiet plea for somebody to make that data available somewhere.
Where did you get that data?
Since 2000, the city of Chicago has been tracking all of their criminal activity using their CLEAR database. The majority of the data on crime type and location has been put online to allow the public to have open access to it. This has been used in other projects to visualize local crime maps, report recent crimes, and display other trends.
So is that it?
I hope not. I really want other people to pick this up and work on it so I've put it all up in a GitHub project for someone else to run with. Anyone is free to modify it any way they want, and I'll push their mods to the original if they work. So please help and have fun.