Google Analytics for Scrolling on a Static Website (or Google Analytics is Creepy)
A couple of months ago, I helped one of my friends set up Scroll Tracking with Google Analytics on an experimental website. While working on this I discovered that I could do really cool/creepy stuff like download the scroll event data on a user-by-user basis.
Setting up (free) Google Analytics for Website Usage Tracking
Because my friend was using a static site on Github Pages, it wasn't possible to set up a database to track the interactions with her website. Instead, we decided to use Google Analytics (GA) to do the storing of all that interaction data. This is great because GA can be used for free, but as we'll see, this can lead to drawbacks.
The first step in scroll tracking is getting Google Analytics set up to listen in on the activity on your website. This process is pretty straightforward and the steps are covered here. At the end of this step, you'll be able to log in and see the number of pageviews and such on the GA site.
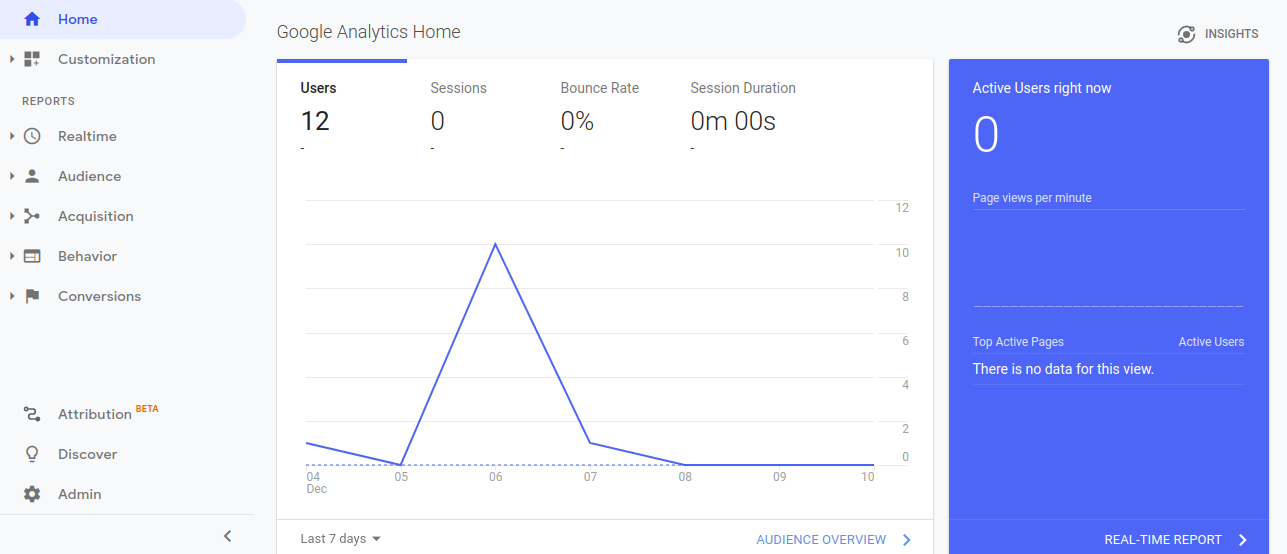
This is an alright overview of the number of people who have visited the site, but we want to get more interesting event level detail like scroll tracking. There are a number of tutorials that explain how to do Scroll Tracking, but this one was a good start that got it working for me. I added a ton more levels to get granularity down to the single percent. After that is set up, you can view the Behavior->Events tab and see all of the Scroll Tracking events in a timeline.

But we're actually interested in how far people scroll down the page. As explained in the link above, you can get this table by selecting the "Top Events" tab and then setting the primary dimension as "Event Action."
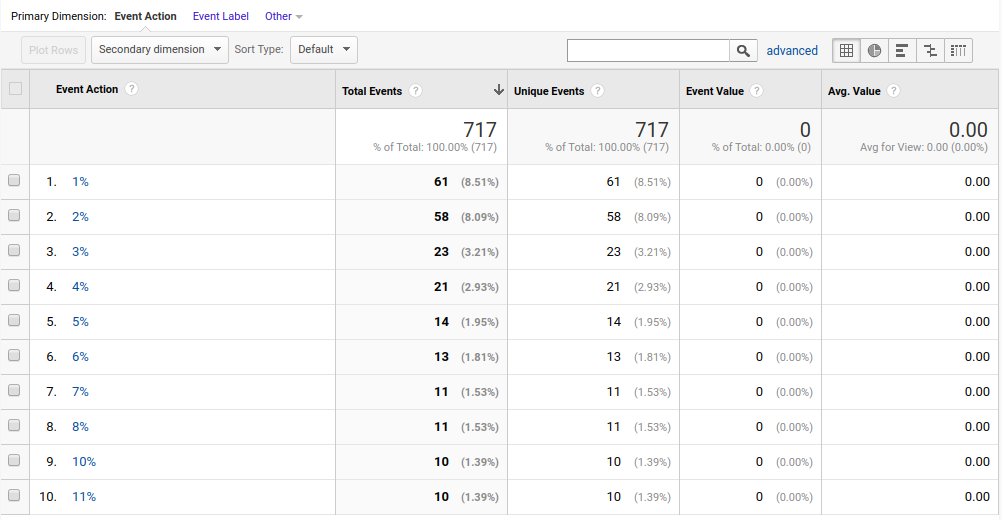
This table gives a decent overall summary, but it's hard to get down to more detail than this. You can use the "Secondary Dimension" to get it broken down into a little more detail, but it's still pretty high level. Also, if you want to download this data, you can only export the table as it appears, not with any more detail.
Getting User-Event Level Data
To get down to Event Level Records I did two things:
- Add custom variables to disambiguate users on each event
- Use google2pandas to download the raw event data
The first item was necessary to disambiguate multiple users so that I could reconstruct their scroll event history on an individual basis. Otherwise, everyone who scrolled at the same time would be mixed together in the data. The second item just allowed me to get every record directly instead of needing to go through the GA UI and get aggregated data. I break the process of working with those two thins down in the next sections.
Adding User Variables to the Scroll Event Tag
I think that if you pay for Google Analytics then you can see the user associated with every event pretty easily . But I'm kind of broke so I don't have that luxury. Instead, to add the user's ID, I needed to pull it out of Google's tracking stuff from the inside and past it back in as a custom variable. After I'd done that I could grab those variables to store in the Scroll Event Tag for later use.
Storing Variables
Google has a way to keep track of the same user across different sessions on your website. It's a little creepy, but it's pretty easy to find a how to on how to do it. The key part is adding a Custom Javascript variable with the following code.
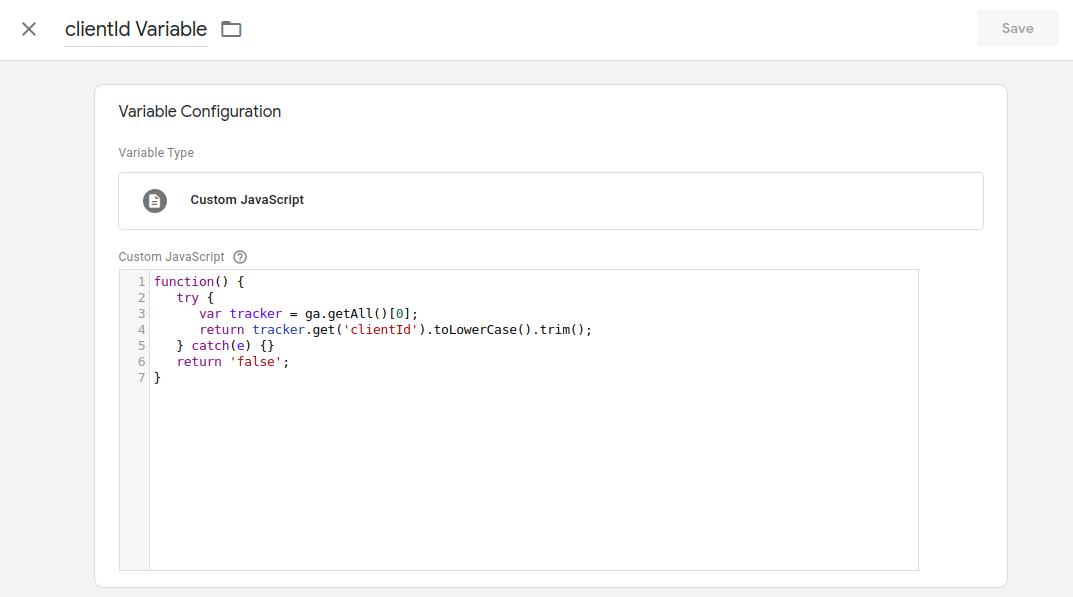
function() {
 try {
 var tracker = ga.getAll()[0];
 return tracker.get('clientId').toLowerCase().trim();
} catch(e) {}
return 'false';
}
Apparently, there is a better way to do this, but I didn't find that until now. The drawback with my method is that the clientId variable will be null if Google hasn't set it yet. To take care of this problem I added a second variable (userId), which I manually populate on the first pageload. That way if Google takes a while to setup the clientId, I can go back and use the userId variable to connect earlier events. Kind of hacky but whatever.
I added the following javascript to my site to make a random ID and add it to the Google Tag Manager's "data layer." The data layer is just a way to pass variables from your local javascript to the GTM's variable space. Note that I also added the variable called contentVersion to track which site update the user was viewing.
After adding this code into the >head< html of my site:
  function makeid() {
  var text = "";
  var possible = "ABCDEFGHIJKLMNOPQRSTUVWXYZabcdefghijklmnopqrstuvwxyz0123456789";

  for (var i = 0; i < 20; i++)
  text += possible.charAt(Math.floor(Math.random() * possible.length));

  return text;
}
var userID = makeid();
dataLayer = [{'userID': userID,'contentVersion':1}];
I added a data layer variable with the same name in GTM.
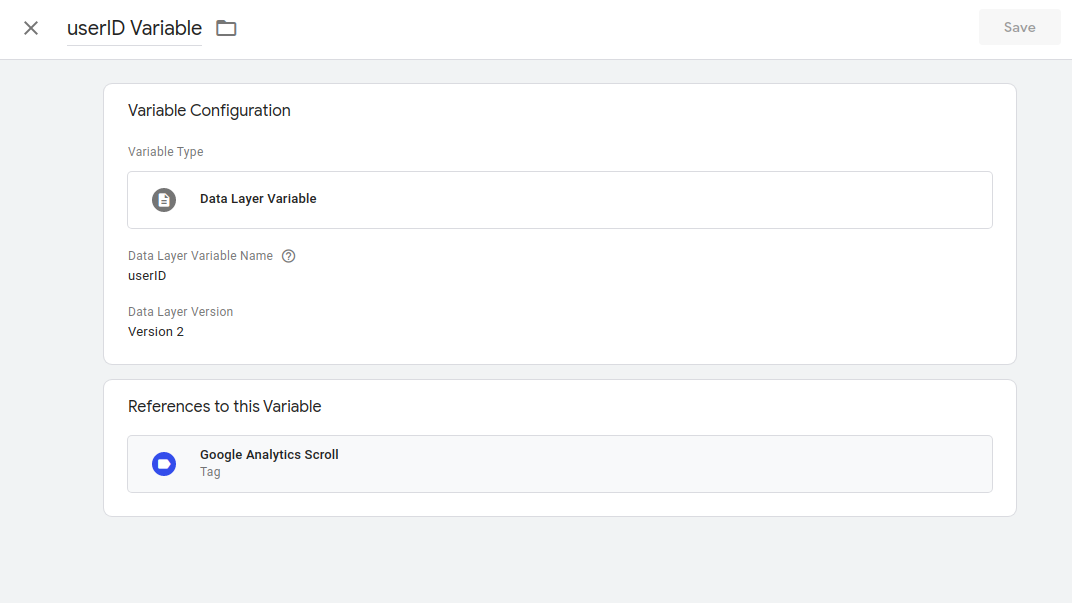
Adding variables to Scroll Events Tag
After I made the variables I just needed to add them to the Scroll Event Tag that I had made before. I just put all of the variables I needed into the "Label" field with colons between them.
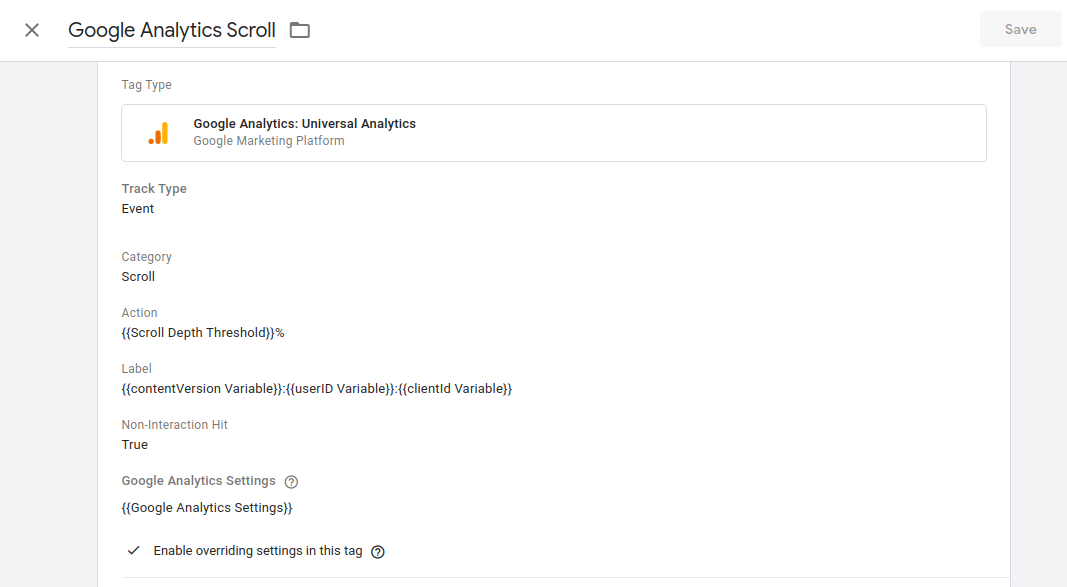
To test I just went back to the GA events table we were looking at above and selected "Event Label" as the primary dimension. This shows the event labels in the specified format {{contentVersion}}:{{userID}}:{{clientId}}.
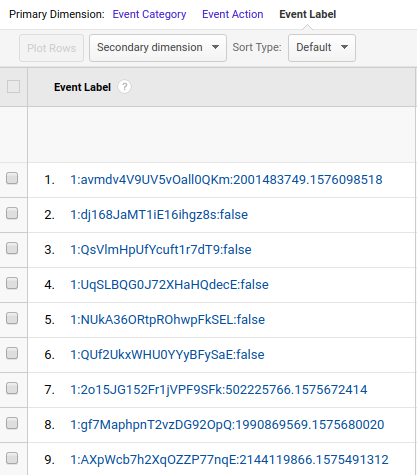
You might notice that the last item (clientId) is frequently "false." That's just because it hadn't been set by google yet.
Downloading events with google2pandas
Now that the data is distinguishable by individual userId, it becomes possible to download it at that level. Rather than using the GA UI, I wanted to write some python scripts. Fortunately, the panalysis group on Github, had the google2pandas repo that could connect and return the data in a pretty pandas data frame.
To download the data I have to send a query structured with the GA viewId, the date ranges, the aggregation dimensions, and the metrics to plot. In this example, I basically just add all the features I have as dimensions and then I get the count of totalEvents as the metric (which should be 1 most of the time anyway).
  from google2pandas import GoogleAnalyticsQueryV4

  conn = GoogleAnalyticsQueryV4(secrets='attention_service_credentials.json')
  scroll_query = {
  'reportRequests': [{
  'viewId' : '187999039',

  'dateRanges': [{
  'startDate' : '2019-11-26',
  'endDate'   : '2020-05-01'}],

  'dimensions' : [
  {'name' : 'ga:eventCategory'},
  {'name' : 'ga:eventAction'},
  {'name' : 'ga:eventLabel'},
  {'name' : 'ga:pagePath'},
  {'name' : 'ga:pageTitle'},
  {'name' : 'ga:dateHourMinute'}],

  'metrics'   : [
  {'expression' : 'ga:totalEvents'}],
}]
}
df_scrolls = conn.execute_query(scroll_query)
I have a working jupyter notebook on this if you want a place to start. You will need to enable the GA API and get your own google_service_credentials.json file by following the instructions here.
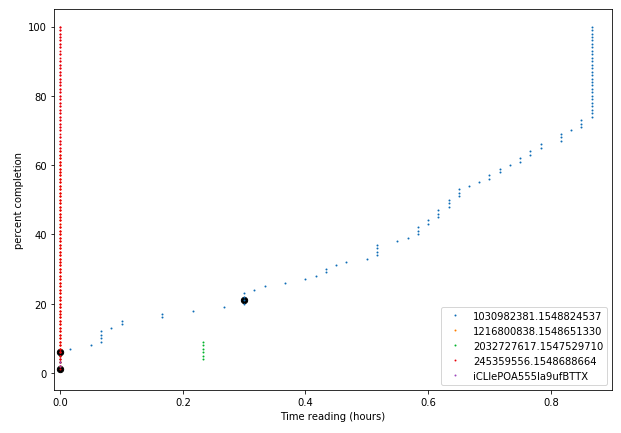
Plotting the scrolling progress
In my jupyter notebook, I graph the scrolling progress for a few people. The data is clearly messy because some people just scroll straight to the bottom. Still, this gave my friend a pretty clear idea that for people who were actually reading it, it took about an hour to finish.
